
🎉 Don't miss our upcoming live webinar on September 17th 🎉
Register for QBeeQ Report Studio: Bridging the gap of last mile reporting here


Highly Interactive
Turn every dashboard viewer into a power user

Drive Adoption
Unlock new ways to communicate insights

Increase Engagement
Close data viz gaps and improve the user experience
Features and Benefits
Better ways to explore data
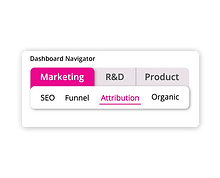
Find the data you’re looking for, fast – with plugins such as the Widget Tabber, Advanced Jump-to-Dashboard, and Filter Bookmarks.


Make dashboards enjoyable again
New templates, views, and filtering capabilities (such as the Date Range Slider) will help you get your dashboarding mojo back.
More power to viewers
Modify and manipulate data on the fly without ever touching an Elasticube, with new capabilities such as Input Parameters and Widget Controllers.

What’s included in the Interactive Design PowerUp?

Our entire library of
interactive design plugins

Every interactive design plugin we’ll release in the future (!)

Ongoing maintenance and support
The Plugins


Filters built to maximize space and deliver a simple,
intuitive experience for dashboard users


_edited.jpg)
Export multiple PDF Dashboard reports by looping throughout a given dimension to create a file per value