
🎉 Don't miss our upcoming live webinar on September 17th 🎉
Register for QBeeQ Report Studio: Bridging the gap of last mile reporting here
QBeeQ Report Studio
Your clients deserve more than a dashboard screenshot
QBeeQ Report Studio is the design-to-delivery layer Sisense was missing. Build pixel-perfect, branded reports from your live data, then get them into the right inbox, Slack channel, or storage folder — automatically, on schedule, without a single external server or third-party tool in the loop.
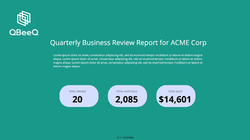
Made using the QBeeQ Report Studio -
 |  |  |
|---|---|---|
 |  |  |
 |
Download this sample file here
The distinction that matters
A dashboard and a report are not the same thing.
Your Sisense dashboards are powerful, interactive tools built for deep analysis. They are designed for the people inside your platform.
But most of the people who need your data are not inside your platform. They are clients, executives, stakeholders - waiting each morning for a clear, branded, actionable snapshot of what matters.
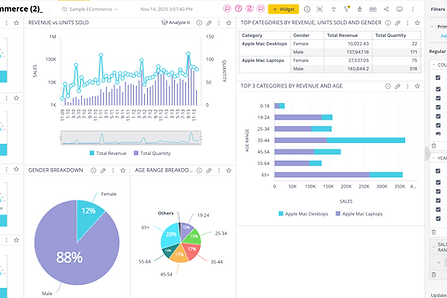
DASHBOARD
Live, interactive, exploratory
Built for the people inside your platform
Dashboard
REPORT
Polished, branded, decisive
Built for everyone else — sent anywhere, designed to drive action
QBeeQ Report Studio Export

Design it. Brand it. Deliver it. Without leaving Sisense.
Report Studio is one continuous workflow, not a design tool bolted onto a delivery tool. Pull live data from any widget across any dashboard onto a freeform canvas. Style it, brand it, template it. Then schedule it — to email, Slack, or storage — triggered on your cadence or by webhook, with no external server and no data ever leaving your environment.
Features
Pixel-perfect reports, built natively in Sisense.
-
Freeform canvas, live data re-rendered as fully editable visuals
-
Multi-dashboard data in a single report
-
Brand profiles per client
-
Built-in and custom templates
-
Scheduled delivery — daily, weekly, monthly, or webhook-triggered
-
Delivery to email, Slack, or storage — for distribution or historical snapshotting
-
Per-recipient filters, no Sisense license required for recipients
-
Export to PDF, PowerPoint, Excel, Word and more coming soon
KEY CAPABILITIES
Everything you need to design and deliver reports your clients will notice.

Brand profiles per client
Save a complete brand profile per client - colors, fonts, logo, chart palette. Apply everything in one click.
Freeform canvas designer
Place, resize, and arrange any element freely. Full layout control with no constraints from the underlying dashboard.

Data re-rendered as new visuals
Live widget data is pulled and rendered fresh on the canvas. Change chart type, palette, and styling independently from the source dashboard

Multiple dashboards, one report
Pull data from any widget across multiple dashboards into a single, unified report document.


Export in any format
PDF, PowerPoint, Excel, Word - with Google Slides coming soon. Any format, for any audience, in one click.

Filter iteration at scale
Export one report per filter dimension value in a single operation. Ideal for per-client or per-job reporting at scale.
 |  |  |
|---|---|---|
 |  |  |
 |
Why Report Studio
Why not just use what is already there?
Getting data out of Sisense has always worked well enough for basic needs. But if you have encountered any of the following, you already know the gap..
Widgets cut off or misaligned in PDF exports
Pivot tables truncated - only the first page of data exported
No way to add commentary, images or brand elements to a report
Report emails locked to licensed Sisense users only
No control over email subject, body or attachment format
Reports are mirrors of dashboards - no independent design layer
Report Studio was built to close every one of these gaps. Completely