The 11 Must-Have Plugins in Every Sisense Deployment
- Ido Darnell
- Jun 27, 2023
- 5 min read

Updated: Jun 28, 2023
Featuring plugins from Sisense, QBeeQ, and RapidBI
If you’re using Sisense, you know that one of the best things about the platform is the ability to extend its native analytics and dashboarding capabilities with plugins. You can find dozens of these on the Sisense marketplace, and use them to tweak all aspects of the Sisense experience.
It can be difficult to know where to get started - which is why we’ve prepared this guide. Below we’ll cover some of the key benefits of using Sisense plugins, and the 10 best plugins that you should check out today.
(BTW, we’re using the term plugins throughout the article, as this is the more commonly used industry term; they are sometimes also referred to as add ons in official Sisense documentation)
Benefits of Sisense Plugins
Address functionality gaps: No single product can do everything perfectly. Sisense plugins can help address gaps in visualization, interactivity, self-service analytics, or mapping. They can be a force and value multiplier for your Sisense deployment.
Improve the Sisense experience for developers and viewers: Choosing the right combination of plugins will enable you to create a richer and more interactive experience for your users. Many plugins offer more possibilities for users of all levels to interact with, understand, and derive insights from data.
Tailor the product to your needs: By incorporating plugins, you can customize the Sisense experience to make it more specific and relevant to your use case, industry, or specific data challenges. Shaping the platform to align with your organization’s objectives and workflows will help drive adoption and increase data utilization.
Reduce dependency on developers: Sisense is uniquely malleable through its various APIs – but interacting with them requires JavaScript coding, which might not be part of your BI team’s core expertise. Plugins help you get the full benefits of Sisense’s customizability without creating additional overhead for your dev team.
11 Essential Plugins to Add to Your Sisense Dashboards
1. Jump to Dashboard

(Image source: Sisense)
This plugin allows viewers to drill from a specific widget point to a new dashboard, and would typically be used to add context to a specific visualization without trying to cram too much into a single dashboard. This opens up new opportunities for data discovery and expanding the storytelling experience.
A JTD plugin is available from Sisense and from QBeeQ.
2. Self-Service Dashboard

This plugin enables Viewers to create and customize their own dashboards using pre-built widgets, without bothering Designers and without touching the Elasticube. These capabilities significantly increase the value you can get from Sisense by boosting data utilization, without jeopardizing governance and stability.
The Self-Service Dashboard is part of the QBeeQ Self Service PowerUp.
3. Advanced Filters

This plugin allows dashboard users to change filter values through a widget on the dashboard itself, rather than the right filter pane, providing better use of dashboard real estate. This is especially useful for dashboards embedded in other applications. Features include single/multi-select, dependent filters, filter toggle buttons, hierarchical expandable filters, and advanced date range filters. You can also add a filter pane pop-up, 'Apply,' 'Reset' buttons, and filter bookmarks.
Get the Advanced Filters plugin from QBeeQ.
4. Input Parameters and Placeholders
Lets users interact with the Sisense dashboard data using various types of numeric input boxes, which can be referenced in formulas and displayed or further processed in widgets. This plugin adds new What-If Analysis capabilities to Sisense and enables users to update, modify, and create new data on the fly without updating Elasticube tables. You can use input parameters for custom grouping, dynamic buckets in histogram charts, dynamic thresholds, aggregated dashboard filters, and many other use cases. Customize further with sliders, knobs, and levers.
Get the Advanced Input Parameters and Placeholders plugin from QBeeQ.
5. Expandable Pivot

A great addition to Sisense’s native pivot tables, this plugin lets users (including viewers) customize table columns, rows and values by dragging and dropping dimensions or measures. Features include row and column expansion, a unique dimension picker, built-in jump-to-dashboard, conditional formatting, and advanced sorting options.
Get the Expandable Pivot plugin as part of the QBeeQ Self Service PowerUp.
6. Choropleth Map

Enhance your mapping capabilities with this powerful and interactive plugin that allows you to visualize several layers of data, such as territory and coordinate data. Pre-built territories include US states, counties, zip codes, EU and UK countries, and you can also add your own custom territories. The map features advanced tooltips with options to add more information, built-in jump-to-dashboard, click to filter, and measure switchers for multiple KPIs. Users can also use lasso cursor for multi-selection and enjoy advanced exporting options.
Get the Choropleth Map plugin from QBeeQ
7. Widget Controller

This plugin adds drop-down menus within widgets, which allow dashboard viewers to switch between predefined measures, dimensions, break-by dimensions, granularities, and chart types. This provides a great data exploration experience, better utilizes both widget and dashboard real estate, and adds a significant self-service aspect to your Sisense dashboard. The Widget Controller works with all native Sisense widgets as well as custom visualization from QBeeQ Data Viz PowerUp.
Get the Widget Controller plugin from QBeeQ.
8. Visualize Queries
This plugin visualizes the queries that a specific widget runs against the ElastiCube, helping you understand which tables and data relationships are used for a specific query or chart. This is useful for troubleshooting widgets, identifying many-to-many relationships, and pinpointing potential causes of slow query performance.
The Visualize Queries plugin is available from Sisense.
9. Report Manager
This plugin provides a UI-based scheduler to send Sisense reports. Use it to share data reports with Sisense users or external stakeholders. The Report Manager provides flexible scheduling capabilities, including event-driven triggers, custom filters, and support for attachments (such as CSV and PDF files). It lets you easily manage and send tailored reports through a centralized tab. It also supports a wide range of options for time-series data – including hourly, weekly, and monthly reports with custom end dates.
Get the Report Manager plugin from Sisense.
10. Widgets Tabber
Allows users to switch between different views or groups of widgets through tabs on the dashboard. This helps organize complex dashboards, reduces clutter, and provides better storytelling capabilities. Paired with the QBeeQ Lazy Load plugin, the Widget Tabber can also improve dashboard performance and reduce loading times, as widgets only load when their respective tab is prompted.
Get the Widget Tabber plugin from QBeeQ.
11. Adaptive Gantt Chart - by RapidBI
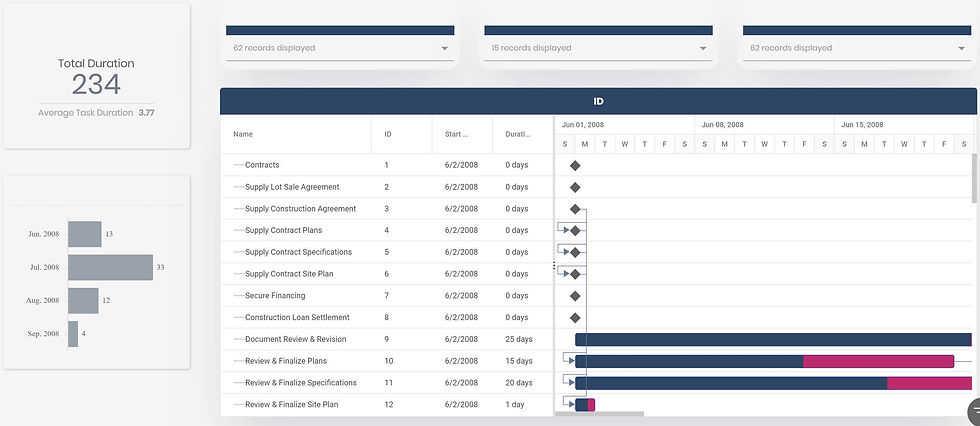
Enable users to use Sisense to track project management by showing progress and schedules within a Sisense dashboard. The Adaptive Gantt Chart by RapidBI allows users to group tasks logically and then collapse and expand them for an easy and slick user experience. Milestones, dependencies and project deliverables are all easy to track and manage.
Get the Adaptive Gantt Chart from RapidBI.
Go Beyond Plugins with QBeeQ’s PowerUps
While a specific plugin can solve a localized issue, we’ve come to realize that to truly level-up the Sisense experience we need to combine multiple solutions around a specific gap area – such as visualization, interactivity, or mapping. We’re now offering our plugins as PowerUp bundles, which come with everything you need to really upgrade a particular aspect of Sisense, along with ongoing maintenance, support, and access to future updates.
We also offer implementation, consulting, training, and really all things Sisense – directly from the people who helped build the product. If you’d like to learn more, get in touch with us today.


Comments