Geographic data can be hard to interpret when presented in raw tables or charts, making it difficult to discern trends or disparities. Traditional visualizations, like bar charts or tables, often overwhelm users with too much information, leaving critical patterns hidden. Without geographic context, the data becomes unclear and abstract, slowing down decision-making.
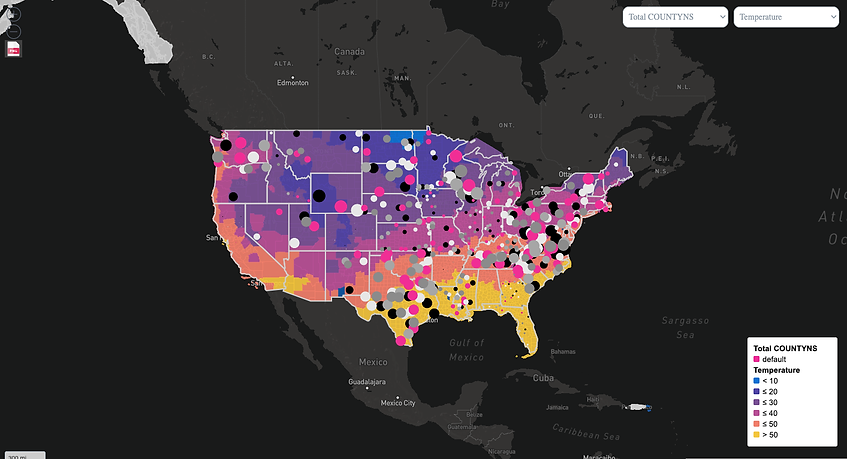
With the Super Map, complex datasets become easy to understand through visually rich choropleth maps. Using color gradients tied directly to data values easily highlights variations, users can spot patterns and trends more quickly. This powerful, intuitive tool makes geographic data both accessible and actionable, enabling users to make informed decisions faster.
Super Map Key Features:
-
Prebuilt Territorial Polygons: Quickly apply visualizations to pre-configured geographic areas like US states, counties, census tracts, EU countries, and UK regions, saving setup time.
-
Custom Territories/Data Sets: Use custom geographic regions or datasets to tailor the map to your specific data and analytical needs.
-
Map Bases: Choose from various map styles (street, bright, dark, satellite) to match your data and presentation preferences.
-
Customizable Design: Customize polygons and points for clearer data representation and improved map effectiveness.
-
Multi-Layer Presentation: Overlay multiple data layers to compare and analyze datasets simultaneously, revealing trends without switching between maps.
-
Interactive Tooltips: Leverage jump-to-dashboard and click-to-filter functionality within tooltips to seamlessly explore data from the map.
-
Customizable Tooltips: Incorporate relevant and contextual information for each polygon or point at a glance for deeper analysis
-
Measure Switcher: Toggle between measures for both polygons and points, creating a wide range of mapping combinations
-
Multi-select Lasso: Select irregular or non-contiguous areas, rather than being limited to predefined regions or boundaries
-
Export Options: Export maps in multiple formats (PNG, PDF, SVG, JPEG) with customizable layout and resolution for easy sharing and presentation.


Whether you're mapping regional sales performance, climate data, or infrastructure access, Super Map helps you transform complex geographic data into clear, actionable insights. Take your geographic data from scattered to meaningful and tell a more compelling story. Empower your team to uncover key insights and make smarter decisions faster!
Super Map is available as a stand-alone or bundled in the QBeeQ Maps PowerUp. If you are interested in a live demo or want to start a free trial, contact us.
Super Map requires the use of an API token from Mapbox, which offers pay-as-you-go pricing, with a generous free tier.