top of page

The Radial Line Graph comes with 2 zoomable axes, X and Y which enable zooming in upon 2 dimensions.

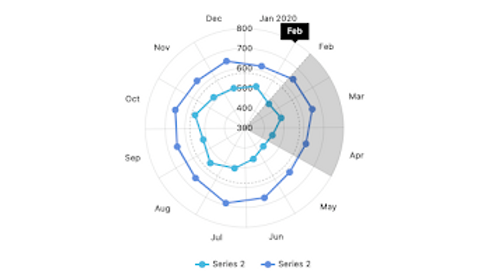
One can also use the mouse to further drill into the visualization for a more detailed view.
bottom of page
The Radial Line Graph comes with 2 zoomable axes, X and Y which enable zooming in upon 2 dimensions.
One can also use the mouse to further drill into the visualization for a more detailed view.